
NID Behind the Scenes: Hydrographers head up into the wilds to conduct snow surveys
Winter snow surveys provide valuable information about how much water will be available to the Nevada Irrigation District (NID) during the spring and summer. So what do District hydrographers do up in the mountains during a survey?

“When I am taking a survey high up in the Sierra, I use snowshoes to get to the places where we measure the snowpack. During my wintry walk, I think about all the snow underneath me. This snowpack will melt and flow downstream so NID can provide water to our fields and towns. This snow is our water source,” says Hydrographer Ashley Vander Meer.
“Each drive of the snow tube tells the story of the snowpack - the weight of winter storms, subtle shifts in temperature, the promise of future runoff. This data shapes forecasts and operational decisions to provide a reliable water supply to NID customers and ensure we are good stewards of this precious resource,” she adds.
Since the 1920s, hydrographers have set out to the upper Sierra to measure the snowpack. These past efforts have established the baseline for a “historic average.” For example, the recent April survey found the snowpack at 98 percent of historic average. That signals that the amount of snow is about the same as all the measurements taken at this time through the years.
These days, NID conducts three official snow surveys each year in February, March and April. The resulting data is used to predict water availability locally and statewide.

During each snow survey, hydrographers take manual measurements at different Sierra Nevada locations and elevations to make accurate forecasts. They focus on five snow courses that span NID’s upper division in the Sierra, which includes the watersheds that provide the District’s source water to be used as irrigation on fields and farms, as well as drinking water for domestic use.
Vander Meer describes the experience: “Snow surveys are both physically demanding and deeply rewarding. Our team starts early, flying in a helicopter up to our five remote snow courses in the Yuba watershed. There’s a mix of excitement and focus as we fly over beautiful frozen landscapes. During the flight, we estimate the snow coverage in different elevation bands so that we can interpolate the snow survey data over the entire watershed. When we land, we strap on our snowshoes and make our way to the start of the course. The work is fulfilling and important. There’s something about standing in the mountain wilderness, measuring the weight of winter.”
Measuring the depth of the snow

Snow depth is measured by extracting a core sample using a snow tube, which is made up of segments attached together depending on the amount of snow. A hydrographer drives the tube deep into the snow until it hits soil. When pulled back up, the snowy core sample provides the data to calculate the depth.
Interestingly, the precipitation pattern of a winter season can be witnessed through a tube as it is driven into many feet of snow. During the action, a hydrographer might hit ice, then soft patches and then ice again. For example, the hardened snow represents the memory of a storm that delivered plentiful snow yet melted a bit with warmer temperatures and then froze again. The soft snow is evidence of a flurry that stayed at the same frozen temperature without icing over.
“Each drive of the snow tube tells the story of the snowpack -- the might of winter storms, subtle shifts in temperature, the promise of future runoff. This data shapes forecasts and operational decisions to provide a reliable water supply to NID customers and ensure we are good stewards of this precious resource,” Vander Meer says.
NID surveyors weigh snow samples. Why is this important?
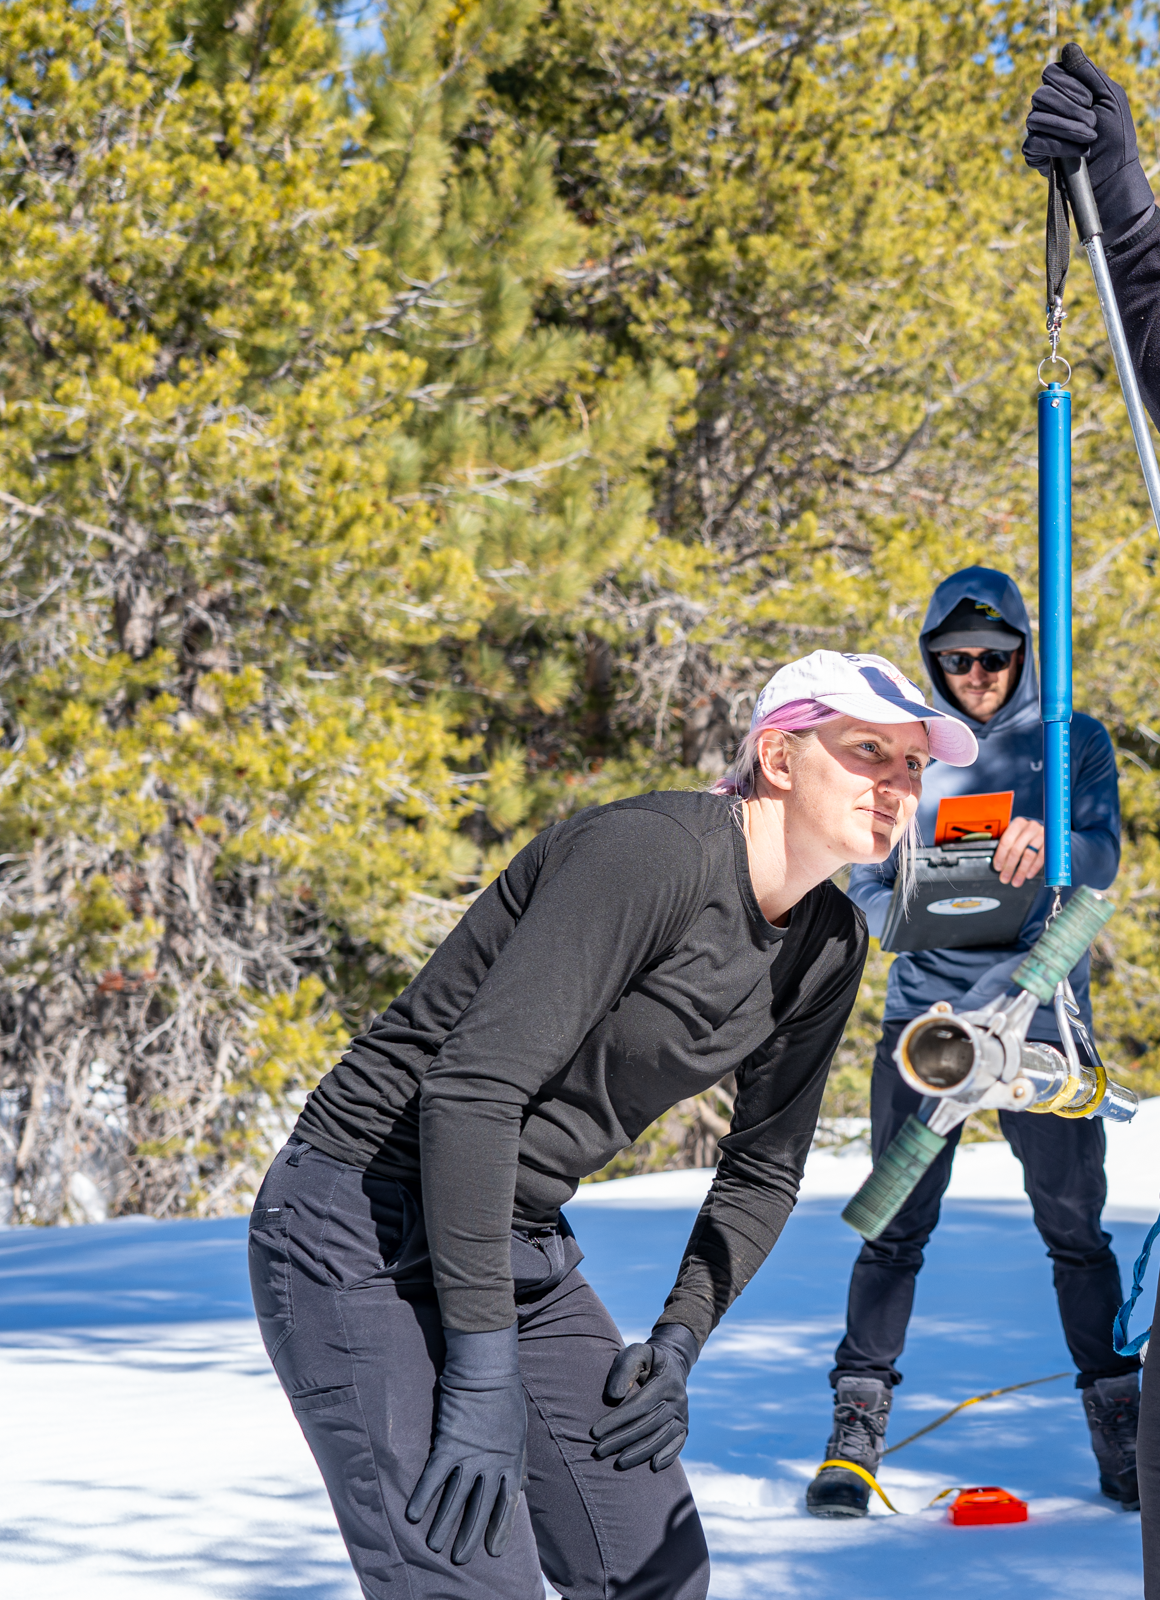
Besides measuring the depth of the snow, the hydrographers also use a scale to weigh the core sample. This determines the amount of water contained in the snowpack, which is known as the snow water equivalent (SWE). That’s basically the amount of water that would run off if the entire snowpack melted instantly.
Measuring the depth of snow at specific locations year after year allows them to track changes in snowpack accumulation to compare different years, while weighing samples allows them to determine the amount of water available in the snow.
Once the hydrographers conduct the survey, back in a heated office NID water managers use the measurements to forecast how much water the snowpack will yield when it melts. That's what determines the water availability for the year.
“This data is used to forecast 70,000 acres of high-elevation watershed,” says Vander Meer. “This is the water that fills our reservoirs that we can then use for deliveries to farms and homes, hydropower and recreation.”
Click here to watch a video narrated by Vander Meer as she and NID hydrographers take a snow survey. https://www.youtube.com/watch?v=kswCpreog6A
The April survey found snow courses are at 98 percent of historic average. Here are the measurements:
- NID’s highest course, Webber Peak, at 7,800 feet, had 108.6 inches of snow with a water content of 42.5 inches (survey taken on March 25)
- English Mountain snow course (7,100 ft.) had 101.4 inches of snow with a water content of 43.3 inches (survey taken on March 25)
- Webber Lake (7,000 ft.) had 85.1 inches of snow with a water content of 33.3 inches (survey taken on March 25)
- Findley Peak (6,500 ft.) had a snowpack of 70.1 inches with a water content of 29 inches (survey taken on March 25)
- Bowman Reservoir (5,650 ft.) had 41.6 inches of snow with a water content of 17 inches (survey taken on March 26)
- At the lower Chalk Bluff snow course (4,850 ft.) on the Deer Creek watershed, 2.6 inches of snow was present with a water content of 0.9 inches, as of March 26 (the Chalk Bluff numbers are not included in the total average).
NID snow surveys trace the history of the District
NID first began taking snow surveys on Findley Peak (elevation 6,500 feet) in April of 1927. Within a couple of years, surveyors also were trekking to Bowman Reservoir (elevation 5,650 feet) to measure snow accumulation. Bowman historically receives an average of 69.2 inches of precipitation annually. By comparison, the average in Nevada City (elevation 2,700 feet) is 56 inches and in Grass Valley (elevation 2,400 feet) is 52 inches.
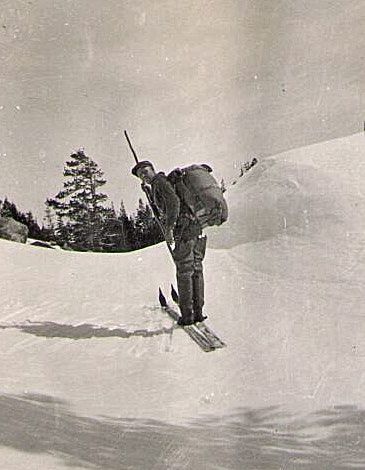
So what was a snow survey like in the early days? Skis and grit were definitely required. In April 1935, Hydrographer Percy Bosanko and Alfred H. Kramm (whose father owned Grass Valley’s Kramm Jewelers, now Stucki’s Jewelers), ventured on skis to the top of the Sierra to take the survey at various snow courses.
Kramm chronicled the week-long trip that covered 57 miles in a journal. Click here to read the journal entries.

Excerpts include:
April 1: … Our horses had on snowshoes -- a sort of circular disc, fastened to the horses’ hoof with a nut and bold arrangement -- but in spite of this the snow in places was so soft that they went through to their bellies.
April 2: The afternoon was perhaps the most arduous part of the day’s travel. Percy thought we could save time to Toll House Meadows by leaving the road and cutting across country in a more direct line. Soon we were scaling the sides of the mountains. In back of us the floor of the valley spread out miles – the opposite hills were obscured by the driving snow. We stopped on a rocky ledge to rest a moment.
A nearby rock of a sort of granite or slate formation showed a distinct fossil of a large brake fern. I was elated with it and wanted to mark the spot so I could come up again, in better weather, with a geologist to look at it. I asked Percy exactly where we were. He laughed at me and said “someplace on English Mountain.”
April 4: By 12:00 we had reached the Finley Peak course. The snow was driving, and infuriated it seemed, and we were drenched-- but "the work must go on." In the middle of the afternoon we reached the Jackson Meadows course.
April 5: We had a grand lunch of Oyster soup and stewed tomatoes. Refreshed we proceeded to the Milton Bowman North Portal entrance gate to raise it as per instructions. We found it all the way down--and then the task began. One hour and a half of steady grinding as fast as we could turn the compound gearing. The water thundered below us as the gate raised and a sulpherous odor of stale water greeted us as it rushed under the big gate and through the 5 mile tunnel.
April 7: … it wasn't until 2:00 in the afternoon that we "took off” so to speak--in a cloudburst, smothered in raincoats that extended almost to our skiis. Around our heads we wrapped towels (for lack of rain hats) which we removed every 15 minutes, wrung out, and replaced until again watersoaked. The snow was miserably wet and we couldn't get rides at all. The wind blew a gale and the raindrops stung our faces like hail stones in a tornado. The rain even penetrated under our raincoats. By the time we reached Graniteville at 5:10 P.M., we were soaked to the skin.
READ THE JOURNAL ENTRIES DESCRIBING THE WEEK-LONG SNOW SURVEY, CLICK HERE.
